
At Security Discovery, we utilize Fly.io’s Grafana service to monitor the performance metrics of our Laravel application(s). Keep reading if you’re interested in implementing Prometheus and Fly.io with Laravel.
1. Install Prometheus
You might need to install further dependencies depending on the adapter you will use. We are using Redis, so we needed to install the phpredis PHP extension. You can read more at https://github.com/promphp/prometheus_client_php.
composer require promphp/prometheus_client_php2. Setup Prometheus Client
We have chosen to utilize the Redis service provided by Fly.io (via Upstash.io). To connect to this service, the connection details must be provided to the Prometheus Redis adapter. If you are not using the REDIS_URL variable to configure your Redis database, you must adjust the following code accordingly.
<?php

use Prometheus\CollectorRegistry;
use Prometheus\Storage\Adapter;
use Prometheus\Storage\Redis;

class AppServiceProvider extends ServiceProvider
{
    public function register()
    {
        $this->app->bind(Adapter::class, function () {
            $conn = parse_url(config('database.redis.default.url'));

            return new Redis(
                [
                    'host' => $conn['host'],
                    'port' => $conn['port'] ?? 6379,
                    'password' => $conn['pass'],
                ]
            );
        });

        $this->app->singleton(CollectorRegistry::class, function () {
            return new CollectorRegistry($this->app->make(Adapter::class));
        });
    }
}
3. Add your metrics endpoint
We have implemented a secret-based protection for our metrics endpoint.
While other methods are available, such as checking for internal IP addresses or limiting access to the metrics service to a private network, we chose this approach as it allows us to access the service from external sources. However, other alternatives may be considered depending on the use case.
Though, the secret will appear in your logs.
use Prometheus\CollectorRegistry;
use Prometheus\RenderTextFormat;

Route::get('/metrics/{secret}', function (string $secret, CollectorRegistry $collectorRegistry) {
    if ($secret !== config('metrics.secret')) {
        abort(404);
    }

    $renderer = new RenderTextFormat();
    $result = $renderer->render($collectorRegistry->getMetricFamilySamples());

    return response($result, 200)
        ->header('Content-Type', RenderTextFormat::MIME_TYPE);
});
4. Add secret configuration
The /metrics endpoint is protected using a secret. Create a new configuration file in the “config” directory with the name “metrics.php”.
<?php

return [
    /**
     * The secret used to protect the /metrics endpoint.
     * This endpoint should be only accessed by Fly.io.
     */
    'secret' => env('METRICS_SECRET'),
];
5. Add your metrics secret to your environment variables
METRICS_SECRET="your_unique_secret_911sdhf"flyctl secrets set METRICS_SECRET="your_unique_secret_911sdhf"6. Tell Fly.io to ingest your metrics
Add the metrics section to your fly.toml file.
[metrics]
  path = "/metrics/your_unique_secret_911sdhf"
  port = 8080
Fly doesn’t allow us to use a specific secret variable. I assume the typical way to protect the metrics endpoint is to check the IP address, but we still decided to stick with the secret path technique.
7. Create your first metric
To test the integration, we decided to add a Laravel command to register and set a metric.
php artisan make:command SynchronizeMetrics<?php
namespace App\Console\Commands;
use App\Models\User;
use Illuminate\Console\Command;
use Prometheus\CollectorRegistry;
class SynchronizeMetrics extends Command
{
/**
* The name and signature of the console command.
*
* @var string
*/
protected $signature = 'sync:metrics';
/**
* The console command description.
*
* @var string
*/
protected $description = 'Synchronizes Metrics for Fly.io (/metrics, Prometheus endpoint).';
/**
* Execute the console command.
*
* @return int
* @throws \Prometheus\Exception\MetricsRegistrationException
*/
public function handle(CollectorRegistry $registry)
{
$counter = $registry->getOrRegisterGauge('app', 'users_count', 'The amount of users in our database');
$counter->set(User::count());
return Command::SUCCESS;
}
}8. Run the new command
php artisan sync:metrics9. Add the new metric to your dashboard.
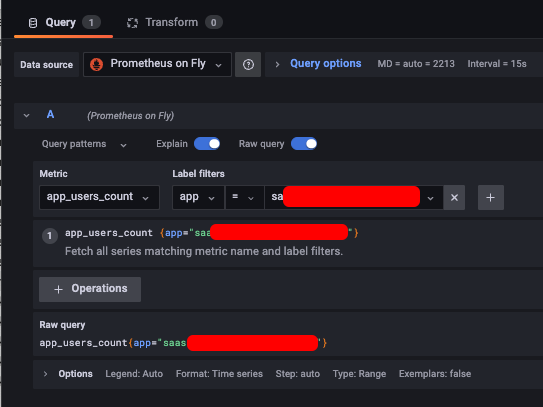
10. Up to you!
You now have the foundation in place to incorporate additional metrics into your application. As an example, you could consider adding code to your middleware that tracks important metric data for requests, providing further insight into the performance of your application.